What is an Infographic. Free tools
Their popularity stems largely from their ability to present textual content in a creative, eye-catching, and most importantly, easily understandable way.
These features make infographics highly favored in the world of digital marketing due to their strong viral potential.
Thus, they can appeal to all kinds of audiences!
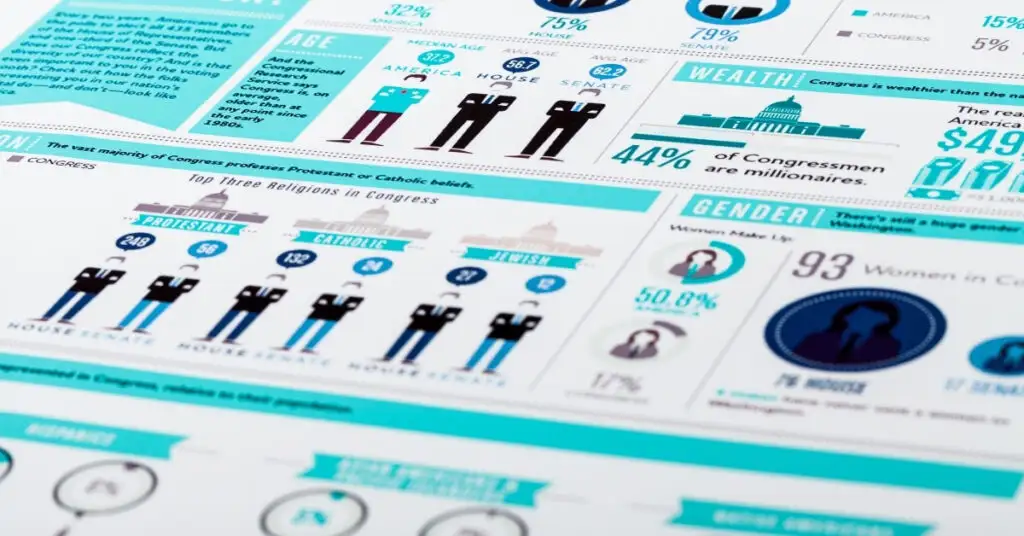
¿What is an infographic?
It’s a graphic piece that conveys information and data in various formats, such as images, number charts, simple text, and a variety of colors and designs.
One of its main features is the design, which, thanks to its visual appeal, serves to share information in a concrete, striking, and creative manner.
Infographics are therefore useful for:
- Providing a quick overview of a topic.
- Explaining a complex process or instruction guide.
- Displaying research findings or survey data.
- Summarizing a blog post or an extensive report.
- Comparing and contrasting multiple options.
- Raising awareness about an issue or cause.
- Designing timelines or chronological information.
With an infographic, you can display relevant information that might otherwise seem lengthy and uninteresting to users.
Infographics in Digital Marketing
Digital marketing agencies prefer using infographics for brand awareness (or branding) and boosting engagement with a target audience and customers.
They are incredibly useful for promoting the SEO growth of a website or a business blog.
Besides, they can be employed in email marketing campaigns, summarizing e-books, enhancing the graphic elements of online courses and webinars, and creating downloadable graphic files for users…
Infographics have numerous applications in the digital world and can become powerful tools on social media and websites, especially if their content is primarily: relevant.
What Makes a Good Infographic
Infographics have the power to present complex data in a concise and highly visual manner. When done well, they effectively tell data stories by making information easy to digest, educational, and engaging.
Good infographics need to be focused with a clear idea of who the target audience is and what the main message will be. Start with a powerful title. MIT researchers conducted an eye-tracking study to determine how people process information. They found that good headlines are key to audience retention. They draw in your viewer, explain the journey they are about to embark on, and make them curious to learn more.
1. A good infographic is like a good story
It has the ability to take you through different phases, offering intriguing facts and visuals along the way. You can control the flow of your infographic using numbers, headers, color, white space, images, and, of course, graphics.
Your number one job is to show people the data. That’s why you should aim to have the right balance of graphics and visual elements. While your data might work with various types of graphics, it’s up to you to select the one that ensures your message is clear and precise. Always follow best practices for graphics.
2. Simplicity is key
Unless you know how to design complex data visualizations, our best advice is to keep it simple. You don’t want to make your reader work harder than necessary to understand your work. A busy visual is not fun to look at and often distracts from the message.
How Infographics are Made
Creating infographics often refers to data visualization. Designers start by researching the topic and gathering data, then organizing it into a visual format. This can include creating charts, maps, timelines, or other visual elements to help tell the story.
As the popularity of infographics has grown, infographic creators have become more creative with their designs, using animations and interactive elements to provide a more engaging experience for viewers.
Once the infographic is designed, it can be shared with viewers online through social media platforms like Twitter and Facebook, or via printed materials such as brochures and posters. It’s an excellent way to communicate information in a visually appealing manner!
¿Do You Need to Be a Designer to Make Infographics?
You don’t need to be a professional designer to create an infographic. There are many online tools for creating infographics that make it easy to create attractive visualizations from data. These programs come with templates and design options to customize the infographic without needing experience in programming or graphic design.
Use Cases for Infographics
Infographics precede writing as a means of disseminating information: cave paintings are probably the earliest known example. People also created and used maps before the advent of written language.
Today, infographics abound in almost any public setting: traffic signs, subway maps, tag clouds, musical scores, and weather charts are just a few examples, among a multitude of possibilities.
Below are some more use cases for infographics.
1. Business
In business, infographics are used by all levels of management to get an overview of data. Infographics include bar charts, pie charts, histograms, line graphs, tree diagrams, mind maps, Gantt charts, and network diagrams. These tools are often components of business intelligence software.
As the volume of data accumulated in business and elsewhere increases, infographics are increasingly used to help people understand the information contained in that data.
2. Digital Marketing
In digital marketing, infographics can help businesses make their products more visible online. By creating visually appealing content that conveys useful information about the product, customers are more likely to remember it. Furthermore, infographics can help marketers attract potential customers from social media platforms with eye-catching visuals.
3. IT (Information Technology)
In IT, an infographic can be used to illustrate the progress of a project or help explain the architecture of systems or applications to new employees. They also provide succinct summaries that help speed up the decision-making process.
4. Education
Infographics can also be beneficial in education, as they encourage students to interact with complex topics and concepts in a visual way. By presenting information through images, students are more likely to remember the material and stay engaged in the learning process.
Software for Creating Infographics
Today, there are multiple platforms online offering varied designs adaptable to the needs of the information and its design setup.
These can be published on a website or on social media, and can also be part of email marketing content.
Let’s look at some platforms where you can design infographics based on your needs if you don’t have a graphic designer on your team. These tools can greatly help you delve into the world of infographics.
1. Infogram
Infogram is a completely free platform where you can register with your email. And best of all, it’s available in Spanish.
You can integrate information from Excel files and upload your own images, and once your piece is finished, you can share it on your social networks directly from the platform.
2. Canva
Canva is a widely used platform not only for designing infographics but also for its free and paid templates that you can adapt for social media formats, email, web pages, brochures, manuals, and more.
You can create collaborative teams with other members of your company, upload your own images or use those available on the platform.
With the paid version, this platform allows you to have your brand color palette, and access to editable elements and images.
Both in its free and paid versions, you can later share your designs directly from the platform.
3. Pixlr
Pixlr is an online photo editor that offers a plethora of possibilities to make your images unique and attractive.
It has both free and paid versions, offering filters, selectors, masks, etc.
It also accepts all types of file formats including JPEG, Photoshop, PNG, SVG, WebP, among others.
4. Snappa
This platform, available only in English, has a free version that limits downloads to three graphic pieces per month.
Despite this, it’s a very comprehensive platform that offers thousands of editable templates for designing infographics.
Its paid version, like Canva, allows for collaborative projects, including your own brand fonts, and unlimited downloads.
5. Easelly
This tool is one of the most popular with about 3 million active users. Its free version has very limited functions, but the paid platform offers many benefits.
It has multiple editable templates for infographics in categories like timelines, processes, reports, and comparisons, among many others.
Once finished, you can export the file or share it directly from the platform.
Conclusion
As you can see, infographics are an excellent option for presenting content that might otherwise not be as eye-catching or easily shareable.
Their advantages in digital marketing range from viralization, increased website traffic, SEO growth, and even to accompany your webinars.
So, don’t hesitate to integrate this technique into the multiple digital marketing strategies you can apply for your company.
Juan Esteban Yepes